Histography for UESTC
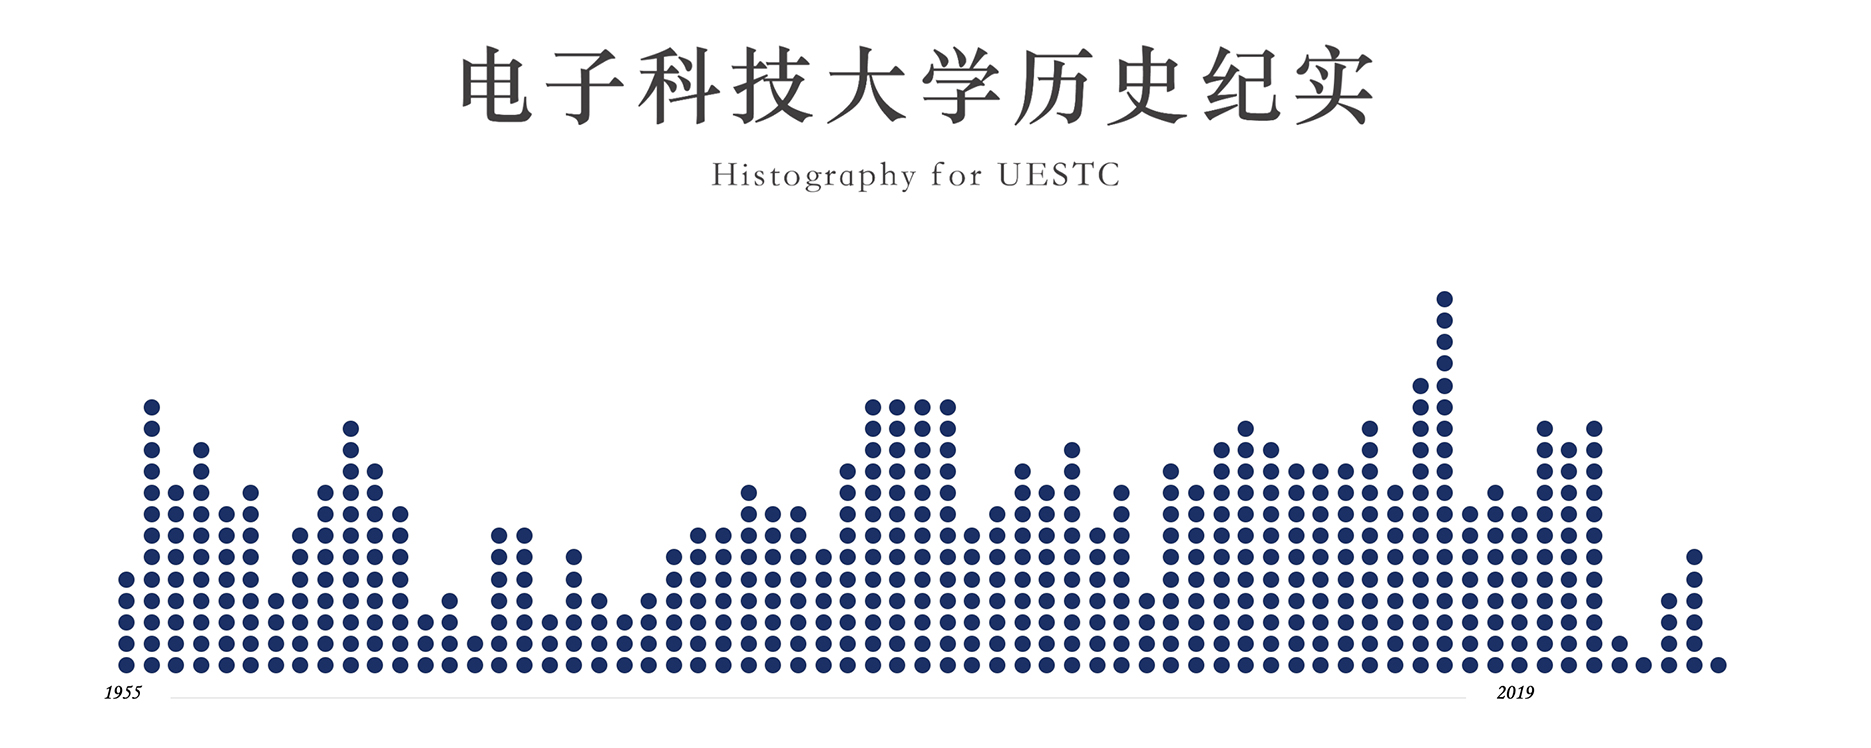
Histography for University of Electronic Science and Technology of China (UESTC) is an individual project completed when doing in the intern in UESTC Upteam. Got the idea from Hisrography - Timeline of History, I combine the timeline with the wall interactive projection to realize a history timeline of my home university in China.
电子科大历史纪实是我在电子科大 Upteam 实习时完成的独立项目。从 Hisrography - Timeline of History 获得灵感,我将时间轴与墙面互动投影结合起来,再现了母校的历史。
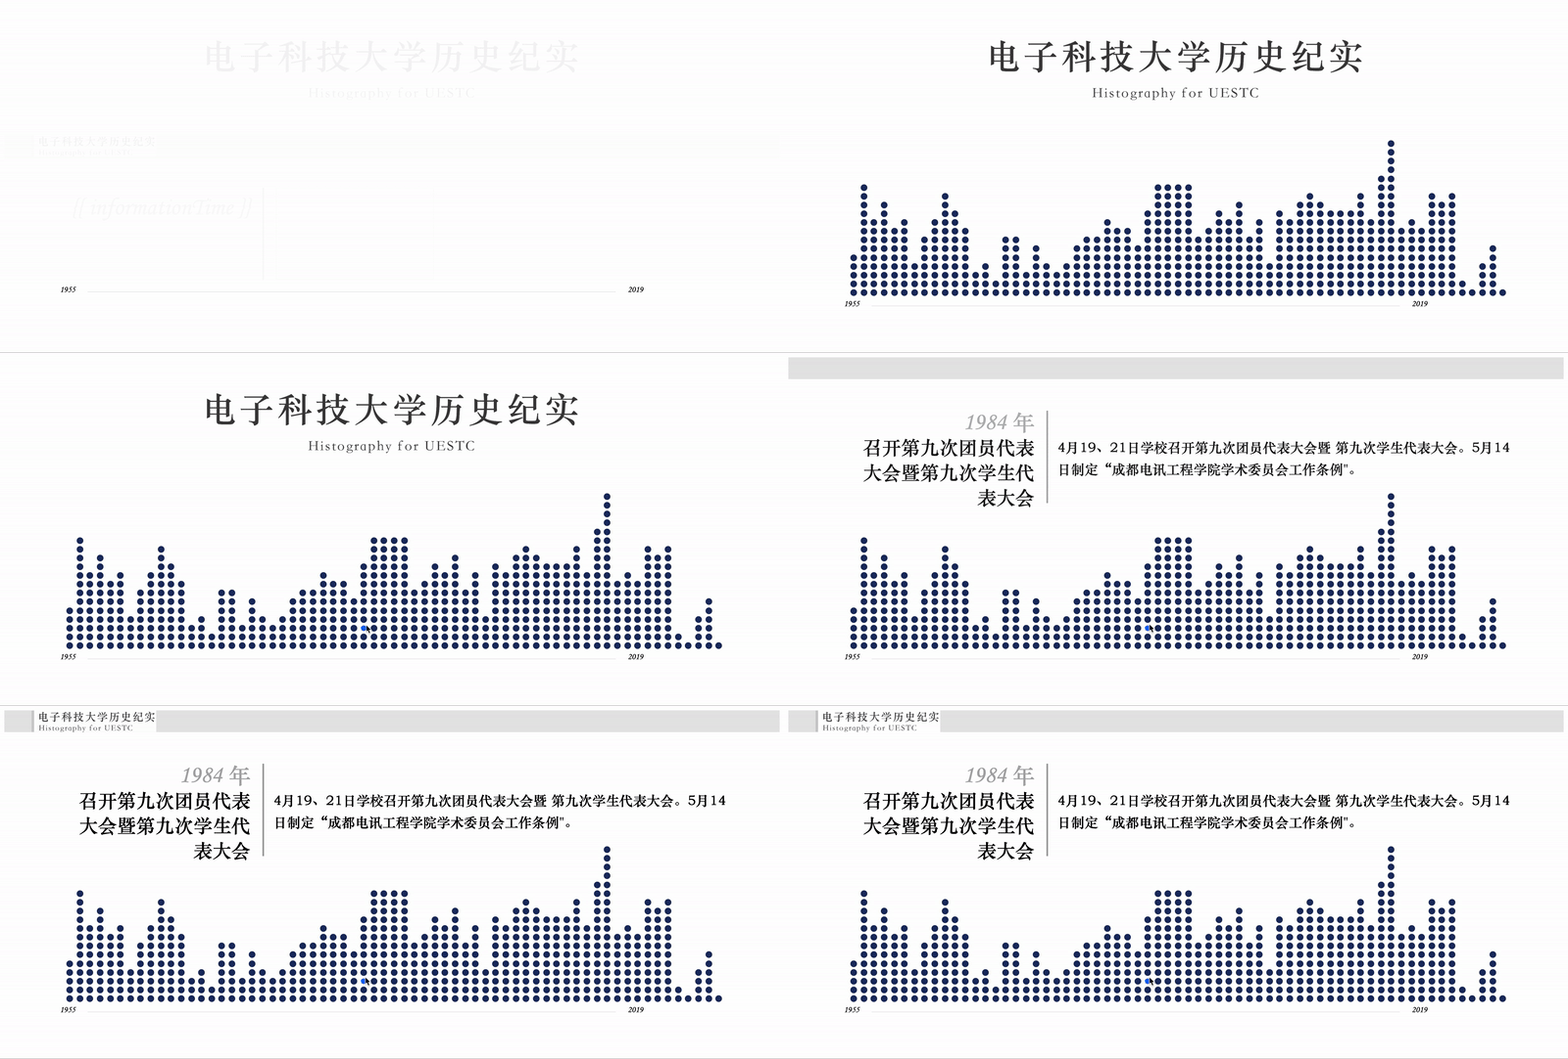
The important thing I needed to mention, is that because of COVID 19, I can't go back to my studio for debugging. Therefore, the pictures below are the webpage screenshot using my laptop. The HTML elements are miss-aligned because of the different resolution between my screen and projector in the studio.
需要说明的是,因为新冠疫情的原因,我没法回到工作室进行调试。因此,下面的图片是我用我的笔记本浏览网页的截图。由于我的屏幕分辨率和工作室的投影仪不同,所以部分 HTMl 元素的位置会显示错误。

(The mouse here mimics the touchpoint on the wall.)
(这里的鼠标模拟投影交互时的点击手势)
The purpose of developing this project is to celebrate the UESTC's 64th anniversary. Different from the mouse interaction webpage, this project aims to create a new interaction method by touching and reading. Therefore, some optimizations were done. For instance, adjust the position and the size of the event dots. The dot colour #1b3065is picked from UESTC's badge.
开发这个项目的目的是为了庆祝母校建校64周年。与通过鼠标进行交互的网页设计不同,这个项目旨在创造一种全新的触目与阅读的交互方式。因此,我们在网页设计上做了一些优化。例如调整事件点的位置和大小,方便用户进行交互。数据点的颜色 #1b3065 来自于电子科大的校徽。
The whole project used Vue.js as the JavaScript framework. The timeline was generated using chart.js.
整个项目选择使用 Vue.js 作为 JavaScript 的框架。时间轴部分则由 chart.js 来完成。

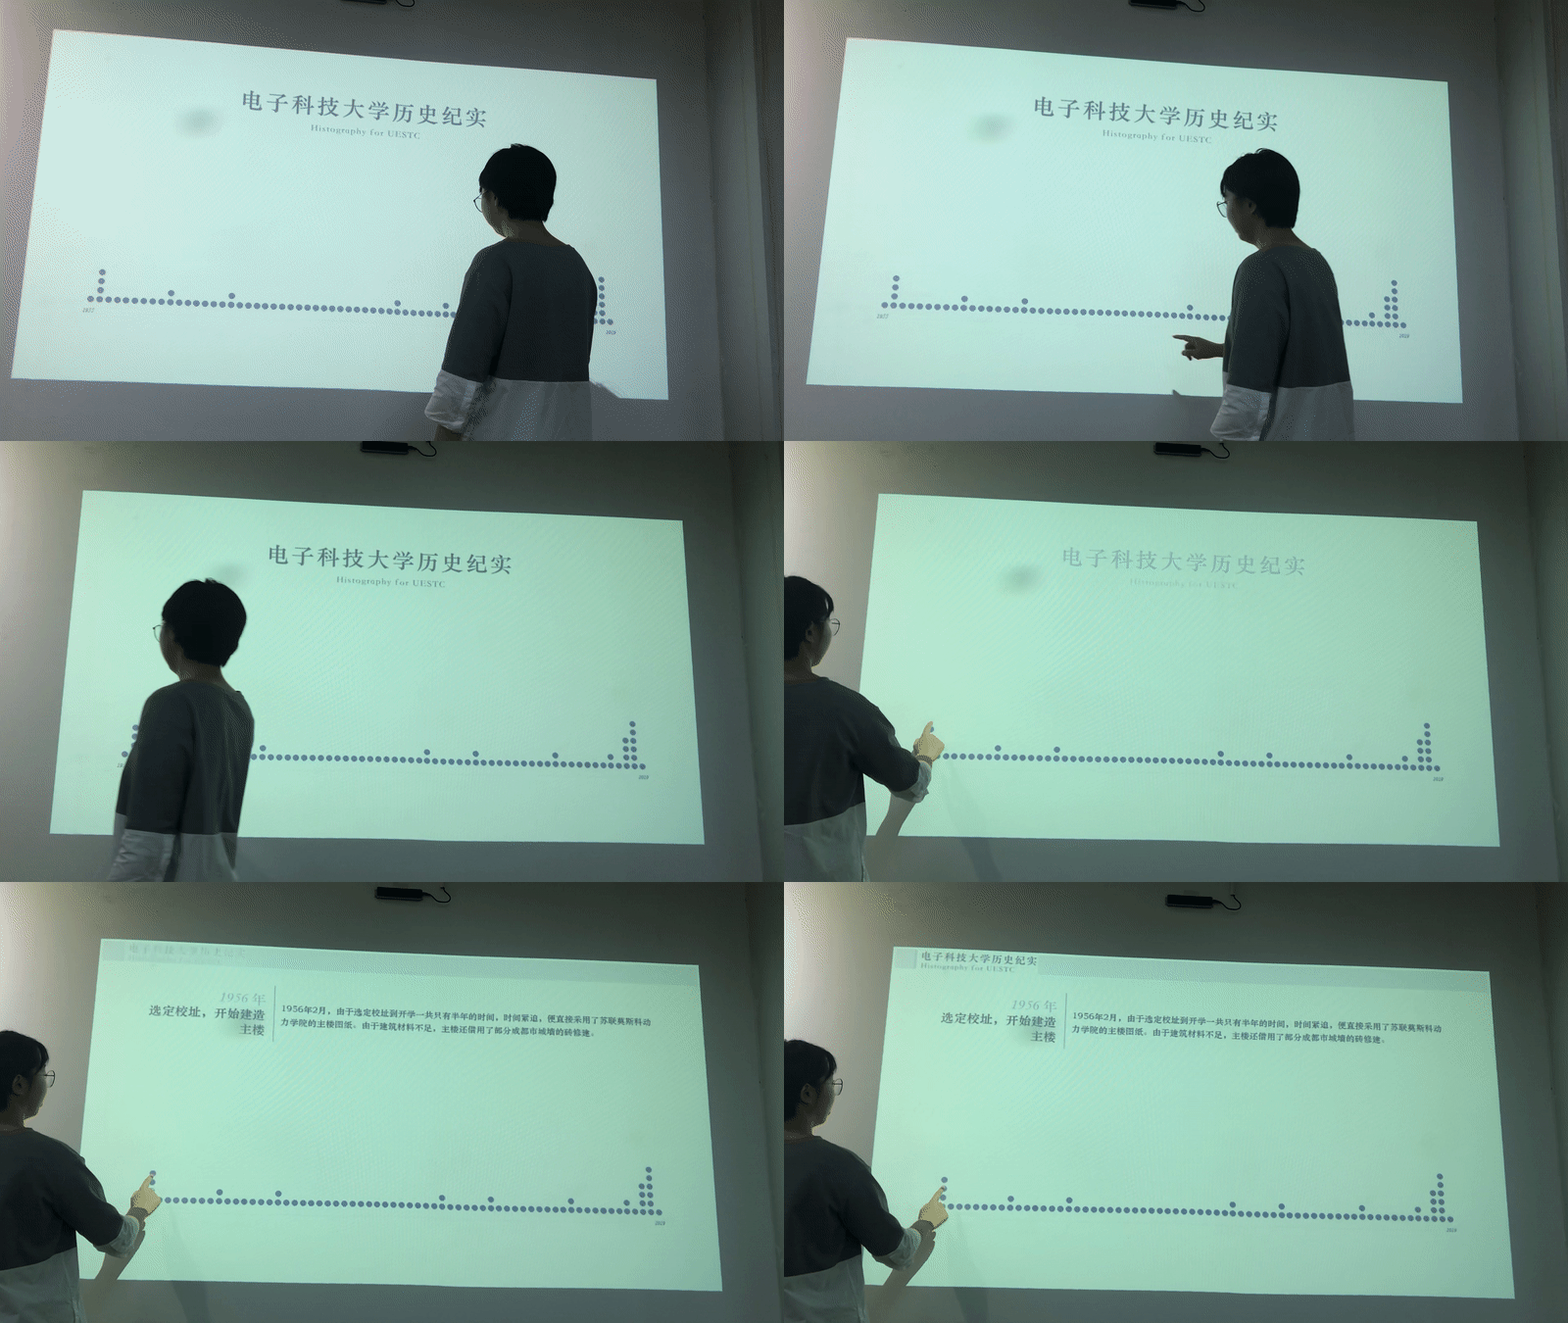
(Debugging in the studio. Sept.12.2019 )
(在工作室进行调试。 2019年9月12日)
